

7 reasons context graphs are unusually effective
Agents need facts that connect across data sources and stay current. Vector search using text chunks gives them neither.

Most agents get their context from text chunks in a vector index. That works when one chunk holds the answer, and it breaks down in two cases. The first is when the answer is spread across sources. Vector search finds the chunk that looks most like the question, but it can miss what the other sources say. The second is when facts change. Old chunks stay in the index next to new ones, and agents can't always tell which one is current. Foundation Capital argues that the context graph "will be the single most valuable asset for companies in the era of AI." Here's the technical case for why.
What a context graph is
A context graph is a knowledge graph built to give agents context. It holds the entities in your data and the facts that connect them, along with when each fact was true and where it came from. An entity is a person, a company, a ticket, a product, or another thing that the data mentions. A relationship connects two entities and represents a fact about them, for example "Sarah AUTHORED Review R-118."
In a graph, each entity is a node, and each relationship is an edge between two nodes. In a context graph, each edge stores one fact, and the fact can carry a validity window (the time range when it was true) and a link to the source data it came from.
1. Agent work is about entities and facts
An agent usually needs a single fact, but a chunk index returns a whole block of text. Questions such as "What does Sarah prefer?", "What is the status of the Acme Corp renewal?", and "When did John move to Denver?" each ask about one entity or one fact.
Studies of real search logs show the same pattern. In a Yahoo search log, the main intent of 58% of queries was an entity, an entity type, an attribute, or a relation (Pound, Mika, and Zaragoza, 2010). In one company's enterprise search log, 59.5% of queries were people searches (Svarre, Lykke, and Bygholm, 2024).
A graph stores exactly these units, so a search returns the entity or fact that answers the question instead of a block of text with the answer buried somewhere inside it.
2. A graph unifies all types of data
Agents read many kinds of data, and the same customer often shows up in several of them. A chunk index stores each source as separate text, so nothing connects those mentions. A context graph can connect them, because every kind of data contains the same two things: entities, such as the customer, and the relationships between them. A graph is built from exactly those, so one graph can hold all of it. In the example below, three sources mention Acme Corp.
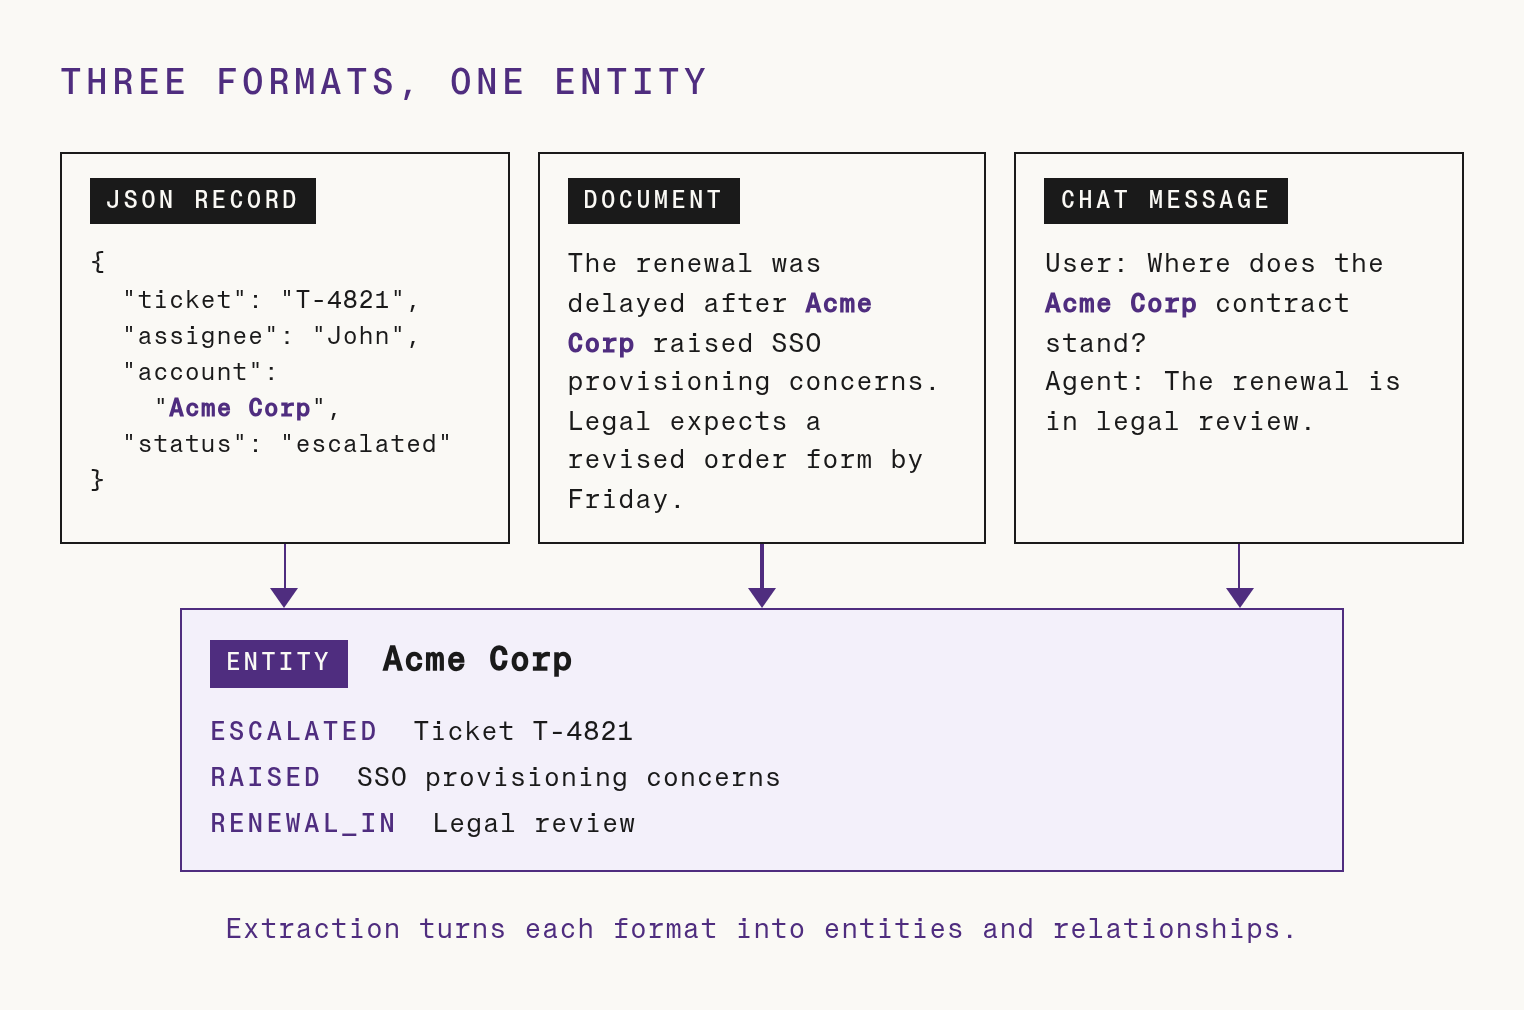
To build a context graph, an LLM reads each record, document, and message as it arrives and extracts its entities and relationships. This step, called extraction, happens at write time. It turns all three formats into the same two primitives and merges every mention of an entity into one entity. In the example, the ticket, the document, and the chat message add three facts to one Acme Corp entity, and a search for Acme Corp gets all three together.
3. A graph answers multi-hop questions
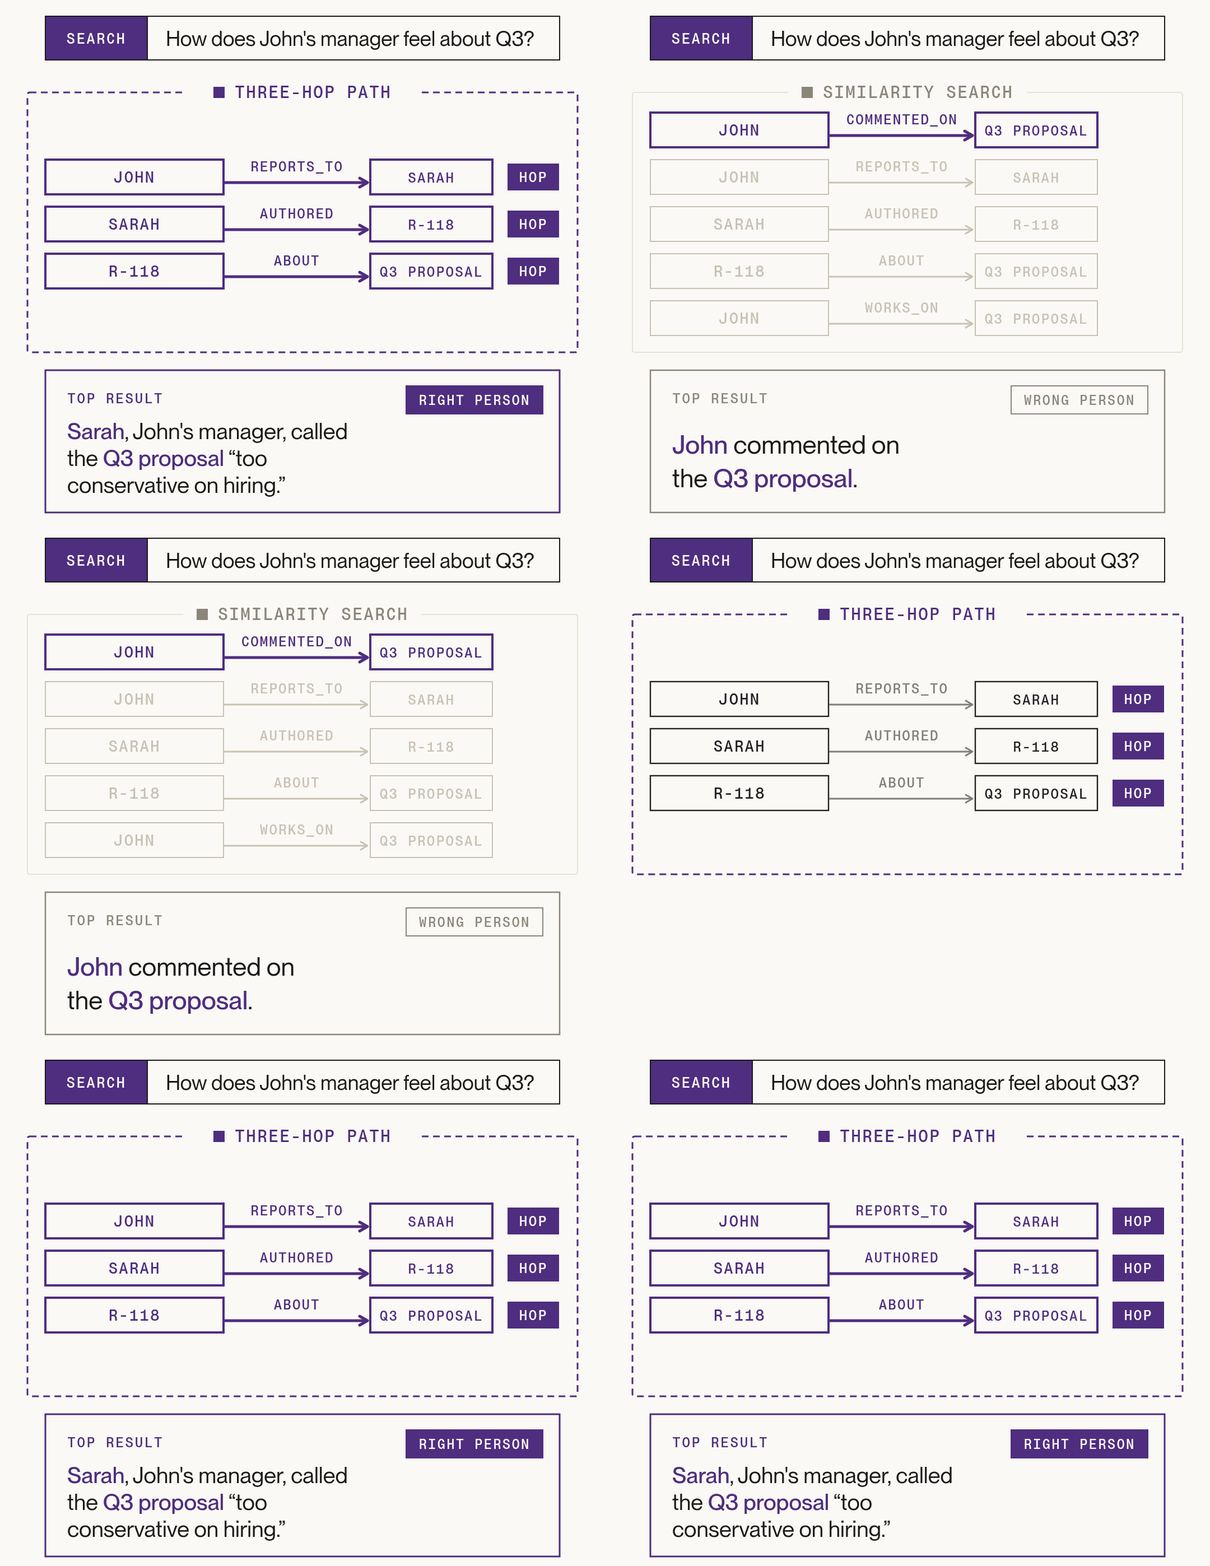
Some questions need more than one step. To answer "How does John's manager feel about the Q3 proposal?", an agent has to find John's manager, Sarah, then the review she wrote, then what the review says about the proposal. Each step follows one relationship, called a hop.
No single document contains the answer. Vector search finds text that looks like the question. Sarah's review doesn't mention John, and search returns John's own comment on the proposal instead. In a graph, the answer is a path: John REPORTS_TO Sarah, Sarah AUTHORED Review R-118, and Review R-118 is ABOUT the Q3 proposal. A graph search finds this path by starting at John and following one edge per hop.
4. A graph records when each fact was true
When a fact changes, a chunk index can return both the old and the new version, and the agent can't tell which one is current. A text chunk can mention dates, but it has no separate start and end time for each fact it contains. The chunk below holds three facts, each with a different validity window.
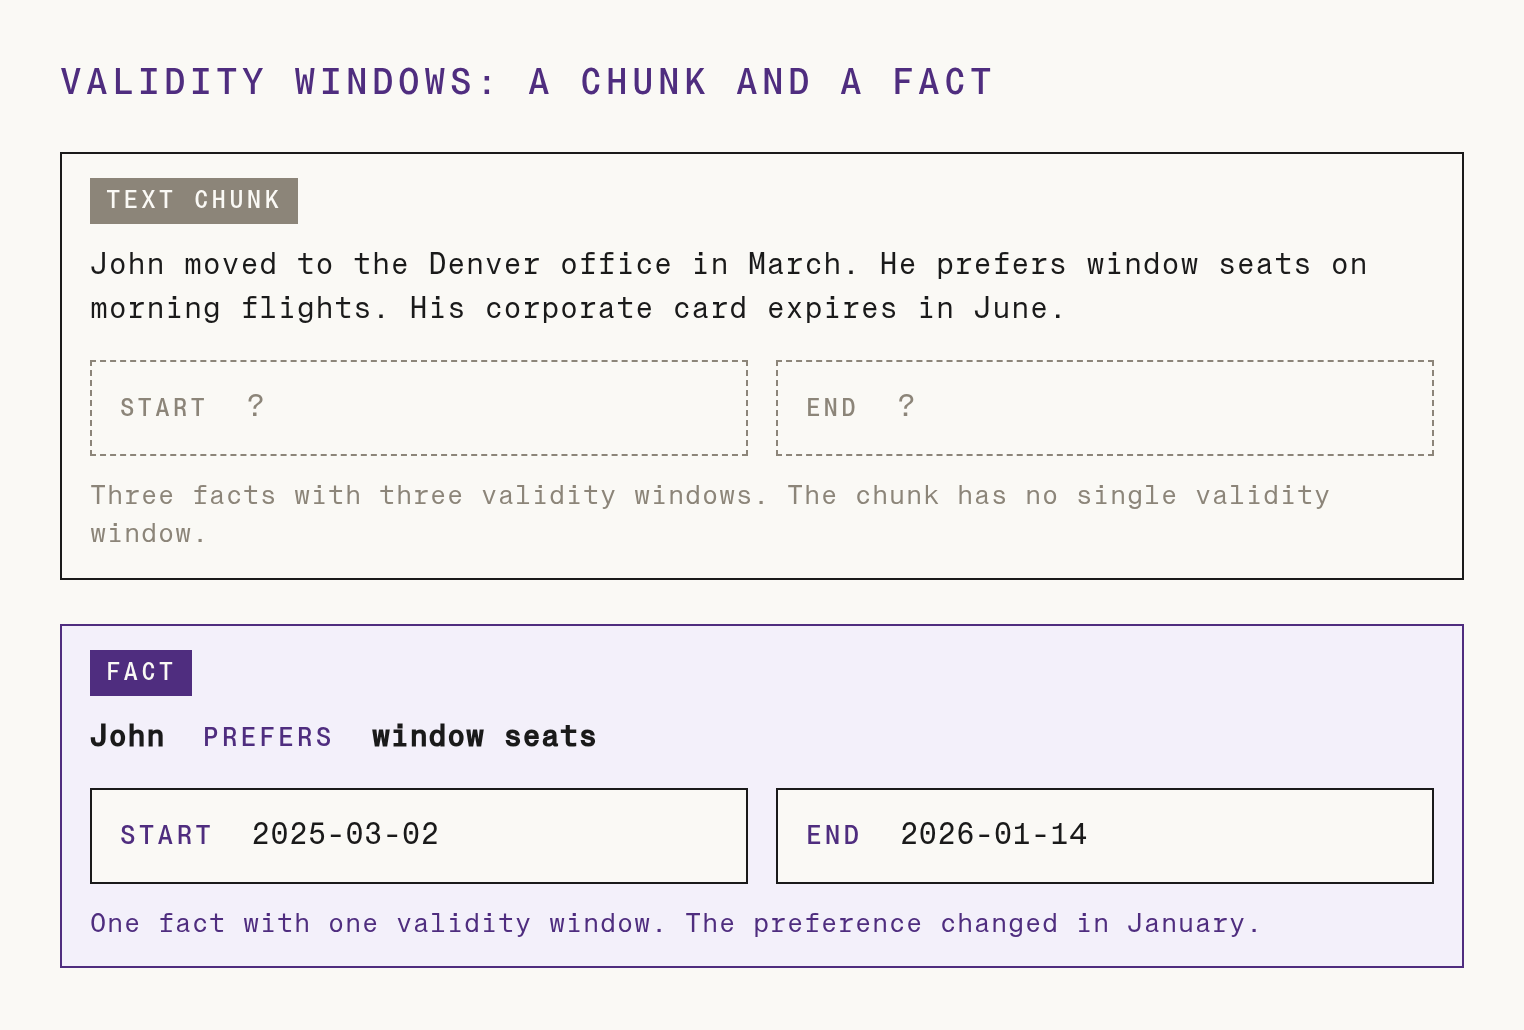
A context graph does not keep the chunk as one unit. Extraction splits it into individual facts, and each fact is a separate edge with its own start and end time. When new data contradicts a fact, the graph sets the end time on the old fact and keeps it. An agent can then ask both what is true now and what was true on a given date. In the example, John preferred window seats from March 2025 until January 2026.
5. The structure of the graph shows patterns
No single record shows a habit, so no chunk contains one. In the example below, John checks his email and then works on tickets in Linear, an issue tracker, week after week. Each action is a separate record, such as one email or one ticket update. In the graph, the facts from all of these records connect to the same entities: John, Email, and Linear. The repetition becomes a structure in the graph. A background process finds that structure and writes a summary of the pattern for agents to read.
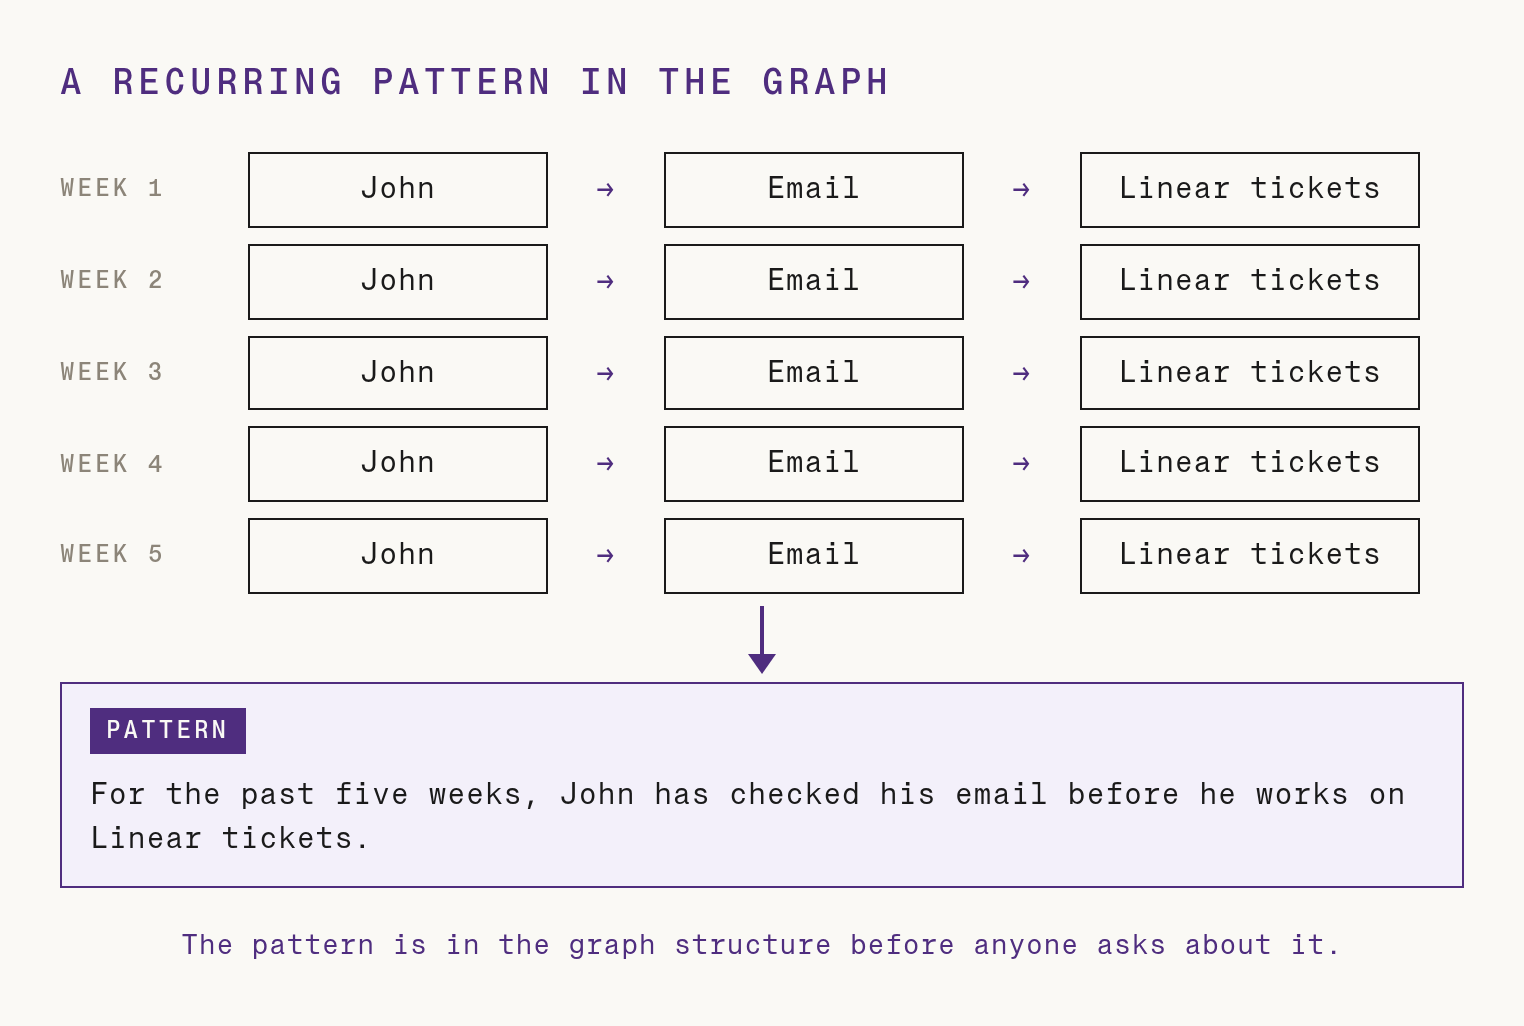
A pattern summary has three uses:
- A pattern summary is a materialized view. The agent reads one statement about John's routine instead of five weeks of facts.
- An agent can use the pattern to predict future behavior. John checked his email and then worked on Linear tickets for five weeks, so an agent can predict the same routine next week.
- People can learn from patterns. A team can use the patterns to understand how users behave.
6. A graph is built once and read many times
A context graph costs more to build than a store of raw text, because an LLM has to extract the entities and relationships. The cost pays off over time. Without a graph, the expensive model reads raw text for every question, including text it has already read many times. With a graph, extraction happens once, when the data arrives, and every later question reuses the facts. The expensive model then reads only those facts, which is far fewer tokens. Databases make the same trade-off: an index costs more to write and makes every later read faster.
The extraction cost is also lower than it looks, because extraction doesn't need the expensive model that answers the question. A small, cheap model can extract the facts at write time, and only the responding agent needs a frontier model. Their input prices differ by up to 100x:
| Model | Input price per 1M tokens | Relative to Claude Haiku 5.5 |
|---|---|---|
| Claude Haiku 5.5 | $0.10 | 1x |
| Gemini 4 Argon | $4.00 | 40x |
| Claude Opus 5.5 | $4.00 | 40x |
| GPT-6 Astra | $10.00 | 100x |
Published standard input prices, checked on October 26, 2026. Claude Haiku 5.5 is the price for prompts up to 100,000 tokens. For Gemini 4 Argon, the table shows the list price that starts on December 1, 2026; a promotional price of $2.00 applies through November 30, 2026. GPT-6 Astra is the short-context price.
With a gap that big, it pays to make many cheap calls if they save tokens on the expensive one. Extraction can make several small-model calls on each document or message, keep the facts, and drop the rest. Each request to the frontier model then reads only the facts, and across many questions the total cost goes down.
7. A graph recalls facts the way people do
Cognitive psychology describes semantic memory, our memory for facts and concepts, as a network of linked ideas. In the spreading-activation theory of Collins and Loftus, each concept is a node, and each link connects two related concepts. When a person thinks of one concept, activation spreads along its links to related concepts, much like a graph search that starts at one entity and follows its edges (reason 3). People recall facts by association: one idea brings up the ideas linked to it. A context graph lets an agent recall the same way, because search starts at the entities the question names and follows their links.
How Zep uses context graphs
Zep uses a context graph as the primary source of context for agents. Zep extracts the entities and facts from structured and unstructured episodes, such as messages, documents, and JSON records, and merges them into one unified Zep Context Graph. Agents can then retrieve context with graph.search, which combines semantic similarity, BM25 full-text search, and graph search, or with our graph traversal methods, such as graph.node.list_neighbors and graph.get_subgraph. Both retrieval methods enable agents to answer multi-hop questions.
Each fact follows a bi-temporal model, with a valid_at time and an invalid_at time, so an agent can tell what is true now and what was true before. In the background, Zep detects recurring patterns in the graph and summarizes them as Observations, which tell an agent how a user usually behaves. Zep keeps graph construction inexpensive with small, low-cost LLMs.
Each fact also links to the episodes it came from, as described in how Zep tracks provenance. Auto Search searches all types of context with one call. Attribute-based access control sets who can read which context. When you delete an episode, Zep removes each fact or entity that no remaining episode supports.
Zep builds these graphs with Graphiti, our open-source engine for building knowledge graphs, and stores them in Konig, our proprietary graph database service built for agent context. The Zep paper describes the full architecture.
FAQ
What is a context graph?
A context graph is a knowledge graph that an agent uses for context. It stores entities, such as people, companies, and tickets, and the relationships between them as facts. Each fact can have a validity window and a link to the source data that it came from.
How is a context graph different from vector RAG?
Vector RAG returns text chunks that are similar to the query. A context graph returns entities and facts, follows relationships across several hops, and stores when each fact was true. A graph search can also use vector similarity and BM25 keyword search, so it keeps the methods of vector RAG and adds the relationships between results.
Does a context graph cost more to build than a vector index?
Yes, at write time, because an LLM must extract the entities and relationships. A small, low-cost model can do the extraction, and the graph amortizes that cost across every later retrieval of the same entities and facts. Each retrieval returns lean context, so the responding agent reads fewer tokens, and each answer costs less.


